
As we know today’s world has a lot of data and it’s important to understand it quickly. Tools like Pandas and NumPy in Python make data analysis easier and save time. With the help of tools like these, we can work with the data faster.
Setting Up Your Environment
Install Python and Required Libraries:
Installing Python for analysis by visiting: python.org
after installing: open the command prompt and type, To check if Python is installed on your device.
python --version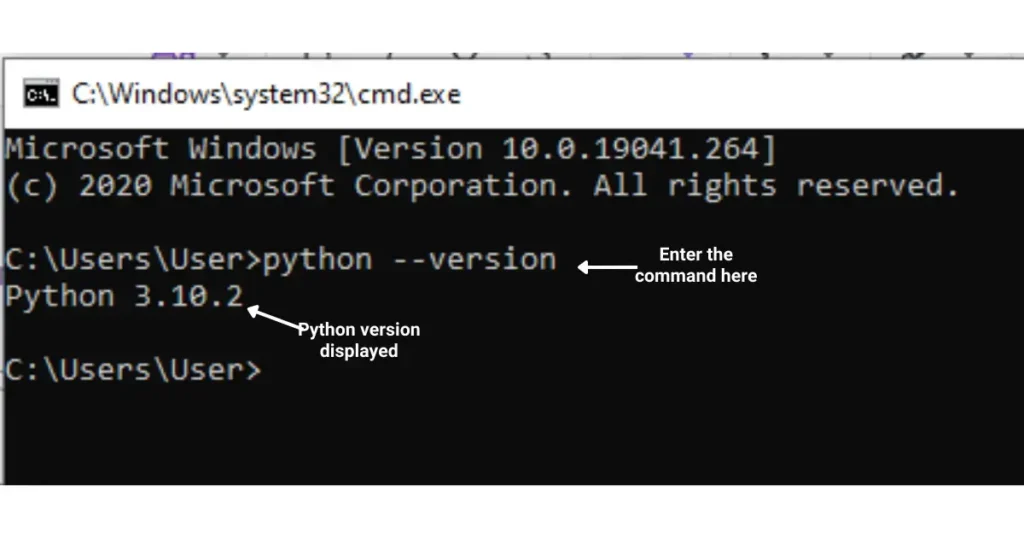
To install the required libraries Type:
pip install pandaspip install numpy
So that you can use them in your project.
Why NumPy and Pandas?
Why install Pandas and the Numpy?
In Python, the Pandas library is mainly used for working with data which will help you load, clean, and edit data easily. You can also do tasks like filtering, sorting, grouping data, etc…
On the other hand, NumPy helps us with numerical data which is used for fast and no error in the mathematical operations on large datasets. It is useful for performing calculations on arrays, matrices, and many other numerical data.
Loading Your Data
Import Data Using Pandas
Pandas is a Python tool that helps you to format your data easily. It can load data from sources like CSV files (Comma Separated Values files) or Excel sheets. After the data is loaded it will go to the table-like structure also known as “DataFrame”. Here’s how to load your data from the CSV file into a Pandas DataFrame.
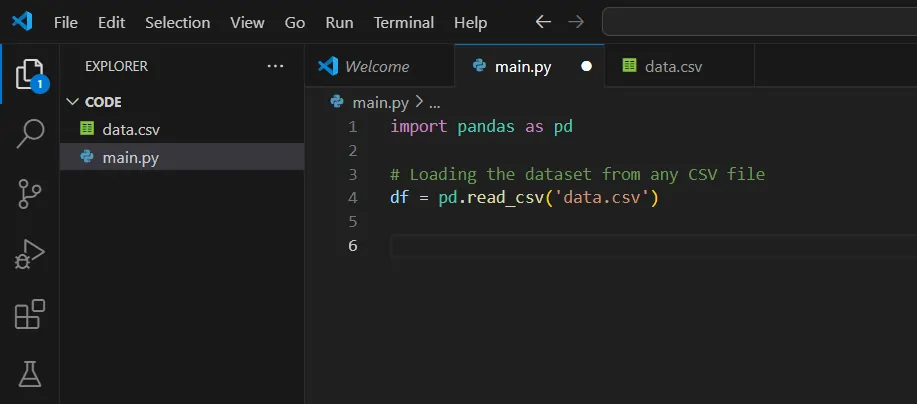
Now, your data is in the df DataFrame and you’re ready to perform your analysis.
Data Cleaning and Preprocessing
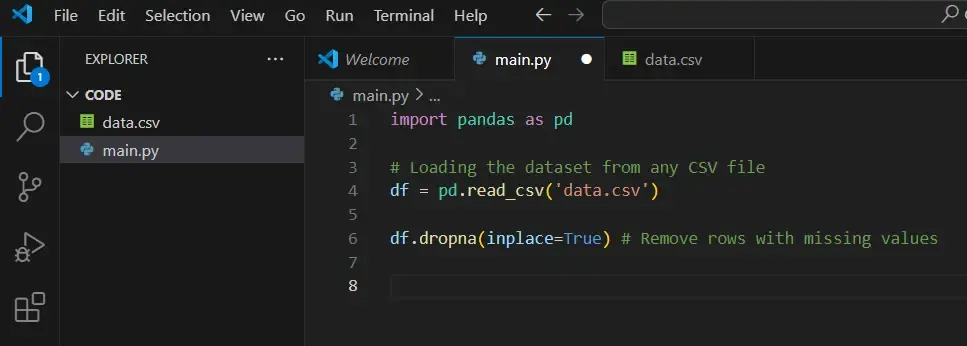
Before you analyze the data you may need to clean it. Your data may have some missing values, repeated information, or minor mistakes. Pandas make it easy to fix these issues using code.
Handling Missing Values
- Remove rows with missing values: What if there are empty spaces in your data? You can remove these rows using:
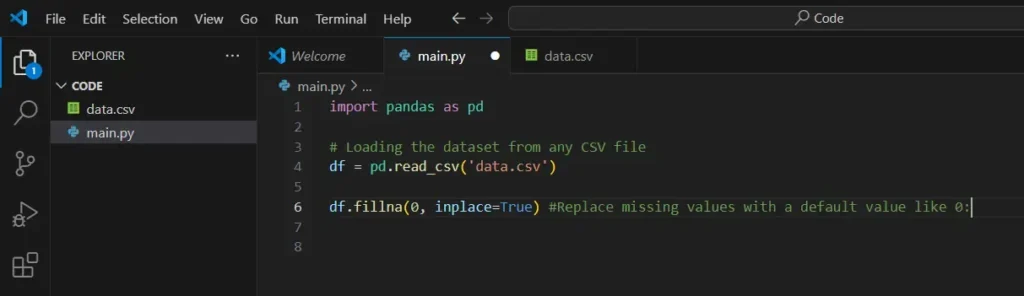
- Replace missing values with a default value: If you don’t want to remove rows, you can fill the missing values with a number using:
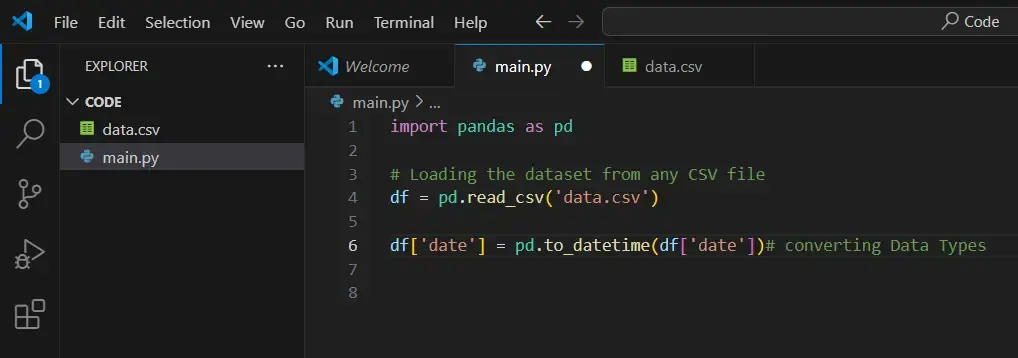
Correcting Data Types:
Your data may not be in the correct format which may cause some errors afterward, for example: Assume your data has a data column but they are written in regular text, You can also change them into a proper data format using:
Exploratory Data Analysis (EDA)
Descriptive Statistics:
After cleaning your data, what you have to do is to get a general idea of what the data look like, using:
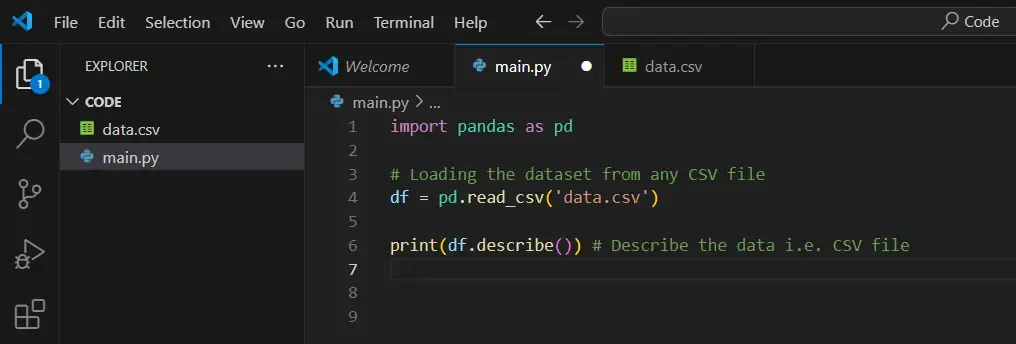
This function will give you the average value and the spread-out data with the lowest and the highest values with the above single command and it will give you a complete overview of your data.
Grouping and Aggregation:
It is also useful to group your data by a category and get some summary of the information for each group, using:
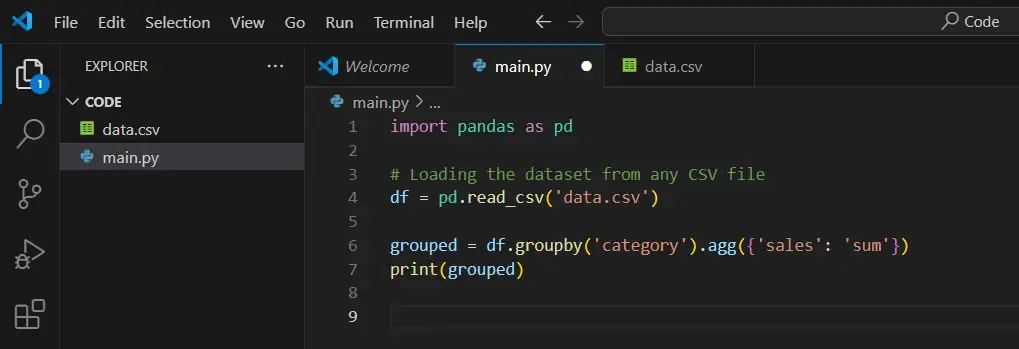
for example: you can get the sum of all the sales by grouping the data by “Category”.
Automating Repetitive Tasks
Since you were analyzing the data. You can save time and make it by automating them by creating a function, that is a reusable block of code that can be used whenever you need it to do some work.
Let’s take an example:
1. The average (mean) of sales data
2. The standard deviation is how much the sales numbers vary.
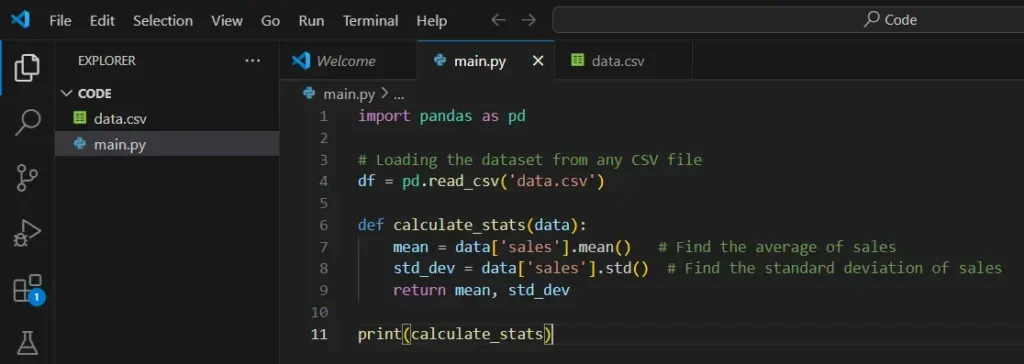
You can call this function whenever you want, calling this function which will quickly calculate the average and the standard deviation for you
Which will make you work faster more organized and reusable for different datasets.
Saving and Exporting Results
Export Processed Data
if you want to share or show your results to others. You can use the Pandas library which will make this easy by saving your data in different formats like CSV,and Excel.
By using the code:
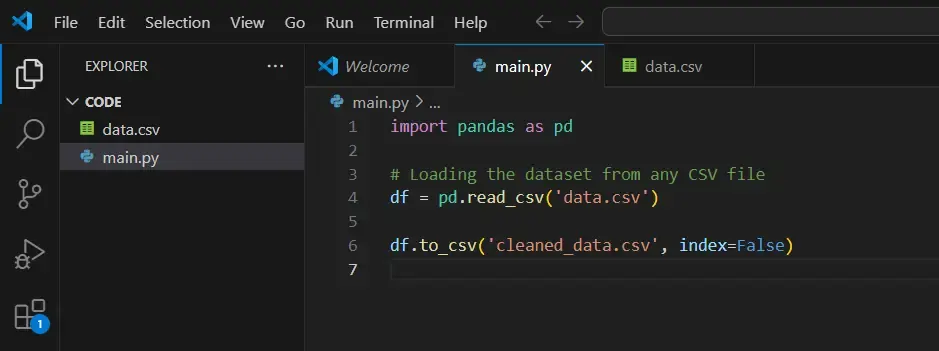
This will create a new file, named “cleaned_data.csv” which you can open later or share with others.
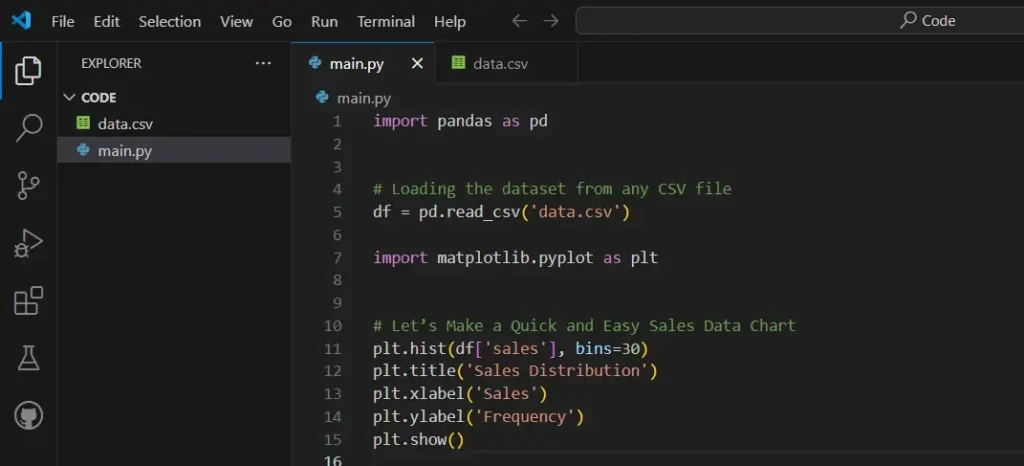
Visualizing Your Data (Optional)
Create Charts and Graphs
The matplotlib is a Python library that creates a type of chart, which helps identify the pattern. When you have a list of how many products were sold each day for a month.
A histogram organizes the data into groups
For example:
Days with
- 0 – 10 sales
- 10 – 20 sales
- 20 – 30 sales and so on…
Benefits of Automating Data Analysis
Efficiency: You can spend your time on the more important work and let your machine handle the data to automate.
Accuracy: People can make mistakes while working with the data, like typing errors or miscalculations.
A machine follows instructions exactly.
Scalability: You yourself can manage a small amount of data manually but what if the data grows into a lot of numbers like a thousand or so.. will you be able to keep up, No!
So to automate a large amount of data without any extra effort you should work with a machine.
Reusability: By creating a function once and reusing it whenever it’s needed, will save some time and make words easier.
Summary
When you are working with the data, Python can help you a lot with its libraries like NumPy and the Pandas which can make your work faster and easier.
Firstly you need to load the data into a format so that you can work with that, Pandas can help you to convert it into a table-like structure called a DataFrame.
After that initial step, you need what’s the most important of all steps which is to clean the data, Which means fixing the missing information or mistakes in the data.
The next step will be to analyze the data. You can simply use the function describe(), for example, to get a basic idea of the data like the average, minimum value, and maximum value.
Now to save time you can also create different functions to do the task for you, like Calculating averages, so you don’t need to code for that.
Then when you are done with that you can save your result in a file format like CSV and share it or you can even use it later, Which will keep it more organized, quick, and easy to manage
After that, you can create charts using histograms with one another Python library named matplotlib which will help you to visualize the data.
In the short term, this will help you to automate tasks and solve any issues easily making you work faster and more accurately.
Related Posts:-
Guide to learn about Top AI Programming Languages
Can you be more specific about the content of your article? After reading it, I still have some doubts. Hope you can help me.
Sure! tell me how can i help you